
Creating data visualizations and identifying trends in data is a critical business function, but it can be time-consuming and often overwhelming. To improve this experience, Google Workspace is making it easier for Sheets users—from small business owners to marketing analysts—to visualize and analyze data using Gemini in Sheets.
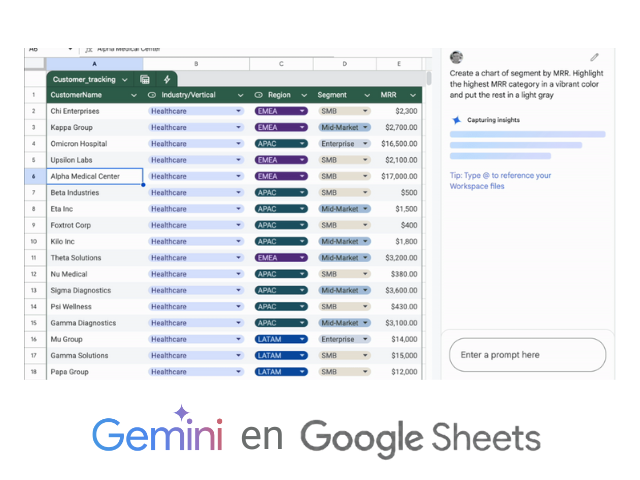
Gemini in Sheets can perform actions or answer questions to address a wide variety of situations. Specifically, you can ask Gemini questions about your data, and it will provide you with valuable insights, such as contextual trends, patterns, and correlations between different variables in your data. Gemini will also generate charts based on your data that you can insert as static images over your spreadsheet cells. For example:
-
A marketing manager analyzing campaign performance can ask, “Provide me with information on my top 3 performing channels by conversion rate” and receive a detailed breakdown with supporting visualizations.
-
A small business owner managing cash flow might ask, “Predict my net income for the next quarter based on historical data” to proactively identify potential shortfalls.
-
A financial analyst investigating inventory trends might ask, “Identify any anomalies in the inventory levels of Product X” to uncover potential supply chain problems or unusual demand patterns.
This update reflects Gemini’s improved intelligence in Sheets, as it now generates valuable results by transforming your queries into Python code, executing them, and then parsing the results for multi-layered analysis. As a result, you can do things like identify top-performing products and then instantly analyze their sales trends—all without writing a single line of code.
Additional details
-
For the most accurate results, make sure your data is formatted consistently, with clear headers and no missing values.
-
When you ask Gemini in Sheets to analyze your data, be as specific as possible in your instructions to ensure Gemini understands your request.
-
For complex analyses, Gemini’s performance in Sheets is most consistent in files with fewer than 1 million cells.
-
For some simpler questions about your data, Gemini in Sheets can still provide answers using formulas instead of Python code.
-
Charts are generated as static images and can be easily inserted into your spreadsheet.
-
Charts are not tied to your spreadsheet data, so they won’t automatically update if your data changes.
-
Once inserted, charts cannot be modified. If you need to make changes, you’ll need to generate a new chart.
Availability
These features are available for Google Workspace:
- Business Standard and Plus
- Enterprise Standard and Plus
- Customers with the Gemini Education or Gemini Education Premium add-on
- Google One AI Premium
Anyone who previously purchased these add-ons will also receive this feature:
- Gemini Business*
- Gemini Enterprise*
Don’t wait any longer and start leveraging the power of Gemini in Google Sheets!
With this new feature, your workflow will be more efficient and productive than ever. Say goodbye to frustration and hello to artificial intelligence!
Contact us and make sure you have the latest version of Google Sheets installed on your computer. Start enjoying smart analytics.
Read the original article here